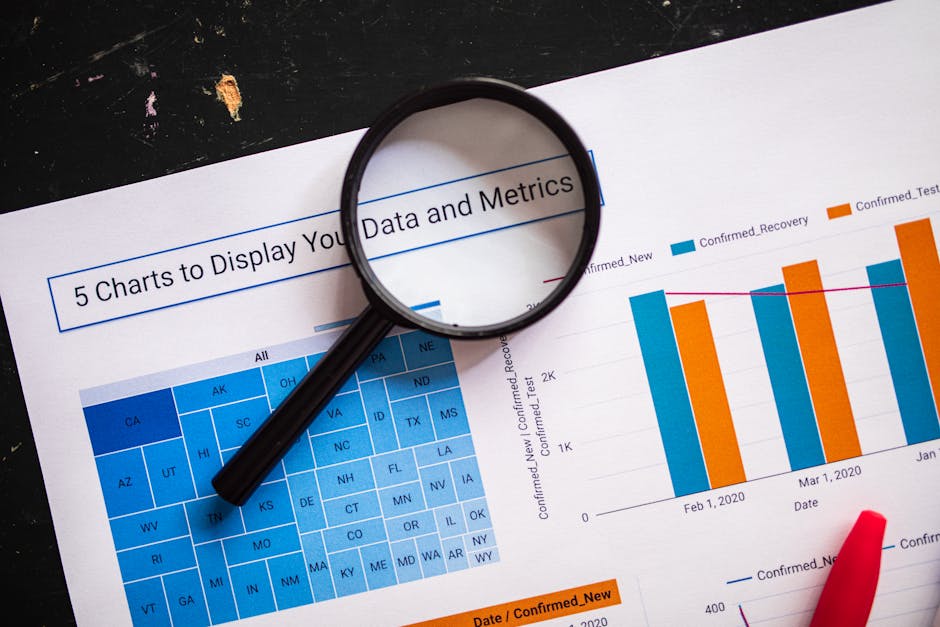
The Dashboard Trap: Why Owner Visibility Breaks at Scale
TL;DR
- •Dashboards that work at 20 people become theater at 100.
- •Owner visibility must shift from “watching everything” to “reviewing exceptions.”
- •Plan → Fact → Gap is the operating layer that keeps signal alive as you scale.
I stopped trusting my own dashboard when we hit about 40 people. It still looked green. The team was still shipping. And I had no idea which projects were actually moving and which were quietly dying.
That is the dashboard trap: you build a view of the company that feels like control, but it breaks the moment you add more teams, more tools, and more handoffs. The numbers stay on the screen. The signal disappears.
If you are an owner of a 30–500 person company, this matters before you buy a single AI tool. You cannot automate what you cannot see. And you cannot trust an AI rollout if your operating visibility is already lying to you.
Definition: Dashboard Trap
Definition: Dashboard trap — the moment a founder’s visibility system stops reflecting reality because the company has outgrown the manual reporting that fed it.
Definition: Plan → Fact → Gap
Definition: Plan → Fact → Gap — a simple operating taxonomy. Plan is what was committed. Fact is what actually happened. Gap is the honest difference between the two, owned by a person, not a tool.
Why Your Dashboard Feels Fine While the Company Drifts
Most owner dashboards start as a spreadsheet or a Notion page. You ask team leads to update it weekly. At first, everyone complies. The view is clean. You feel informed.
Then the company grows. You add a sales team, a support function, maybe a second location. Now five people are updating five different tools. The dashboard becomes an aggregation layer on top of stale data. By the time you open it on Monday, the “green” status on a project is two weeks old.
The trap is not the software. It is the assumption that visibility scales linearly with headcount. It does not. At some point, the owner stops seeing the truth because the team stops surfacing it.
What Breaks First When Visibility Scales
Visibility does not degrade evenly. Three things usually break first:
-
Status updates become theater. Team leads start writing what they think you want to read. “On track” becomes the default answer because nobody wants to be the one red flag in a sea of green.
-
Handoffs go invisible. Work moves between departments, but no single dashboard owns the white space between them. You see each team’s output. You do not see where work dies in transit.
-
Exceptions stop reaching you. The dashboard shows averages. It does not show the one client at risk, the one vendor late on a critical component, or the one engineer blocked for four days.
The Manager Scan: What to Review Instead of the Full Dashboard
Stop reviewing everything. Start reviewing exceptions. Here is what a 2-minute owner digest should contain when you are past 50 people:
- Projects where Fact deviated from Plan by more than 10% this week.
- Handoffs between departments that missed their agreed date.
- Blockers that have been open for more than 48 hours.
- Decisions you deferred last week that still have no owner.
- One metric per function that actually moves the P&L, not activity theater.
If your digest is longer than this, you are not reviewing exceptions. You are reading status reports.
Tool tip (AiAdvisoryBoard.me): The point of Plan → Fact → Gap is not to build a prettier dashboard. It is to force a weekly conversation about where reality diverged from commitment, so you catch drift before it becomes a crisis. See how the 7-day diagnostic surfaces this automatically.
https://aiadvisoryboard.me/?lang=en
Copy/Paste Template: The Owner’s Exception Review
## Weekly Owner Scan — Week of [Date]

### Plan vs Fact Gaps
- [Project name]: Planned [X], Fact [Y]. Gap: [Z]. Owner: [Name].
- [Project name]: Planned [X], Fact [Y]. Gap: [Z]. Owner: [Name].

### Cross-Department Handoffs at Risk
- [Handoff]: From [Team A] to [Team B]. Due [Date]. Status: [Blocked / Late].

### Blockers Open > 48 Hours
- [Blocker]: [Description]. Escalated to [Owner]. Needed by [Date].

### Decisions Waiting on Me
- [Decision]: [Context]. Deadline: [Date].

### One P&L Metric per Function
- Sales: [Metric] vs target.
- Operations: [Metric] vs target.
- Finance: [Metric] vs target.
Micro-Case: What Changes After 7–14 Days
A founder of a 120-person services company was reviewing a weekly dashboard that showed every department “green.” Revenue was flat, but the dashboard did not explain why. After switching to an exception-based review, he surfaced that the sales team had stopped logging CRM updates three weeks earlier. The pipeline looked full because the data was stale. Within two weeks, the team fixed the CRM hygiene, re-engaged three stalled deals, and the founder stopped spending Monday mornings in status meetings that produced no decisions.
Note on this case: This example is illustrative — based on typical patterns we observe with companies of 30–500 employees, not a single named client. Specific numbers are rounded approximations of common ranges, not guarantees.
FAQ
Does this mean I should delete my dashboard?
No. It means you should stop using it as your primary source of truth. Keep the dashboard for trends, but run your weekly decisions from exceptions and gaps.
Who owns the Gap in Plan → Fact → Gap?
The person who committed to the Plan. If no one owns the Gap, the visibility system is decoration.
How is this different from micromanagement?
Micromanagement is telling people how to do their work. Exception review is asking where the plan broke and what support is needed to fix it.
Where does AI fit in?
AI can summarize updates and flag anomalies, but only if the underlying data is honest. Fix the visibility layer first; automate it second.
How often should the owner review this?
Weekly is the minimum for most 30–500 person companies. Daily is too much noise; monthly is too late to catch drift.
If you want a system that surfaces the Plan → Fact → Gap automatically — every day, across the company — see how the 7-day diagnostic works.
https://aiadvisoryboard.me/?lang=en
Frequently Asked Questions
Read with AI
Open this article in your assistant — it will summarize it and help apply it to your company.
Show the prompt
Read the article https://aiadvisoryboard.me/blog/the-dashboard-trap-owner-visibility-breaks-at-scale-revisited.md and summarize the key points. Then ask me about my company (industry, team size, what takes the most time) and explain which ideas from the article apply to us and where to start.
The pillar guide for "Owner Visibility Before AI" linking every article in this cluster.

Implements AI agents in companies and teaches founders and their teams to work with them — through courses and corporate programs.
This article was prepared with AI assistance, based on Yaroslav Maxymovych's methodology and materials. Spotted an inaccuracy — let us know via the form below.
Your company's first 3 AI automations — in 2 weeks
A corporate AI-transition program: 4 live sessions with your team plus a video course for every employee. Up to 20 people for one fixed price. If it doesn't work — money back.
AI adoption resources — one email
Leave your email to receive a welcome email with blog resources. There is no regular newsletter at present
No spam. Unsubscribe anytime.
Related Articles

The Data You Need Before Firing Anyone: An Owner's Pre-Termination Checklist
Before you fire anyone, review 30 days of plan vs fact data, blockers, coaching history, and peer context. An owner's pre-termination checklist that keeps HR decisions evidence-based, not…
Read more
Milestone Burn-Up Chart for Non-Software Projects: A Founder's Visibility Tool
A milestone burn-up chart helps owners track real progress in construction, retail, logistics, and operations projects without relying on subjective percent-complete estimates.
Read more
Security Guard Incident Logs: Auditable Reports for Owners
Learn how to create security guard incident logs that owners can actually audit, ensuring accountability and operational clarity. Discover the key components, digital tools, and reporting culture…
Read more